Ready to make incident response your competitive advantage?
See how Uptime Labs builds provable, scalable incident response capability across your organisation.
When an outage happens, your entire attention is on mitigating its impact. You are fully focused, your brain is working overtime, you are in the zone, probably on a call with team members, and with many dashboards open in your browser. And inevitably, you run into one of those things which seem to slow you down. They can be doubly frustrating in high-pressure situations like this. Some of them can be mitigated with workarounds, whereas others which cannot be mitigated become learnings for the future. Let’s look at some of these time sinks that you might encounter on your outage quest, and also a bit about how to get around them."The competitive advantage is not for a leader to say, ‘Why did it take so long to restore this issue or resolve this outage?’ A competitive advantage is, ‘Oh my God, that is amazing. Tell me what made this hard and what are any of the things that made it difficult to resolve? Is there anything I can do to help get out of the way for people to do the work?’" - John Allspaw, Adaptive Capacity Labs
Locating the Right Person
Some outages need expertise from a different team, or somebody who is not on the current on-call schedule. There are two parts to this - finding out who it is, and contacting them. The first one can be actually easier than the second one if it’s a distributed team. The easiest way to achieve the first is to just ask until you find the right person. In smaller teams and startups, this is much easier. In geo-distributed and remote teams, reaching the other person once you know who it is can be hard if it’s off-hours for them.So how do you mitigate this? I’ve seen distributed teams work on structures where there is an attempt to ensure coverage across time zones for every microservice. For example, if you have a team member in a time zone with a 12 hours difference with you, you can ensure both of you know the microservice(s) well enough to be able to be on-call for it. It involves staying up to date on that service so it’s easier if both of you are in the same team and work on the service.For larger organizations, it can be easy to involve more people and ensure they have knowledge sharing and be on call for the same service. The downside is it can also lead to situations where co-ordination becomes a hassle - and consequently, incident response suffers.
Getting Sidetracked
Uncovering other issues while debugging an outage is not a surprise. You are faced with a dilemma - should you look at the other issues? What if they are lurking beasts waiting to become another incident? What if they are related to the ongoing outage?When things are on fire, clarity can easily take a backseat. You might face pressure from leads or senior folks to look at the other issues. What matters here is figuring out whether the other problems are related to the outage, and if not, if they need immediate attention. Once you have figured it out, let others know.
Missing Runbooks
An incident response best practice is to link alerts directly to your runbooks. On-call engineers can go directly to the runbook when paged. There is nothing worse than a missing runbook when you get an alert. Put your runbooks in a central place accessible by everyone - either in an internal wiki or in your knowledge base software. Make the wiki or KB easily searchable so that your team can find other related runbooks when needed.If your monitoring configuration is in source control (and it should be), you can set a pre-commit hook to ensure that every alert definition points to a runbook.
Missing Access to Tools and Documentation
Imagine this - you respond to a page, and click on the runbook link in the alert message. The runbook points to two dashboards - one for metrics and one for logs.
- You login to the metrics dashboard but cannot login to the logs dashboard. Why? Because they recently moved to a new auth provider and you have just joined this team and they have not migrated your account yet.
- You need to change a configuration setting in the Kubernetes cluster but you don’t have the right IAM permissions in the cloud console. Now you have to find somebody who does, or can give you the right permissions.
Testing your runbooks can prevent such disasters. Carry out periodic mock incident exercises where you attempt to respond to an incident from a brand new machine where you have to login to the wiki, dashboards, cloud consoles etc.. Another dimension to such testing is to let a new member of your team do it. These approaches are not comprehensive but they can uncover many lurking issues.
Missing Metrics and Logs
Somebody forgot to add metrics for a key action or log a specific function call, and now it’s stopping you from figuring out what exactly went wrong. This one can be extremely frustrating because even if you add the metric or the log entry and redeploy your apps, you may not be able to recreate the scenario in production.Well, at least you are prepared for future scenarios, until the next missing metric or log line comes along.
No Correlation Between Deployments and Metrics
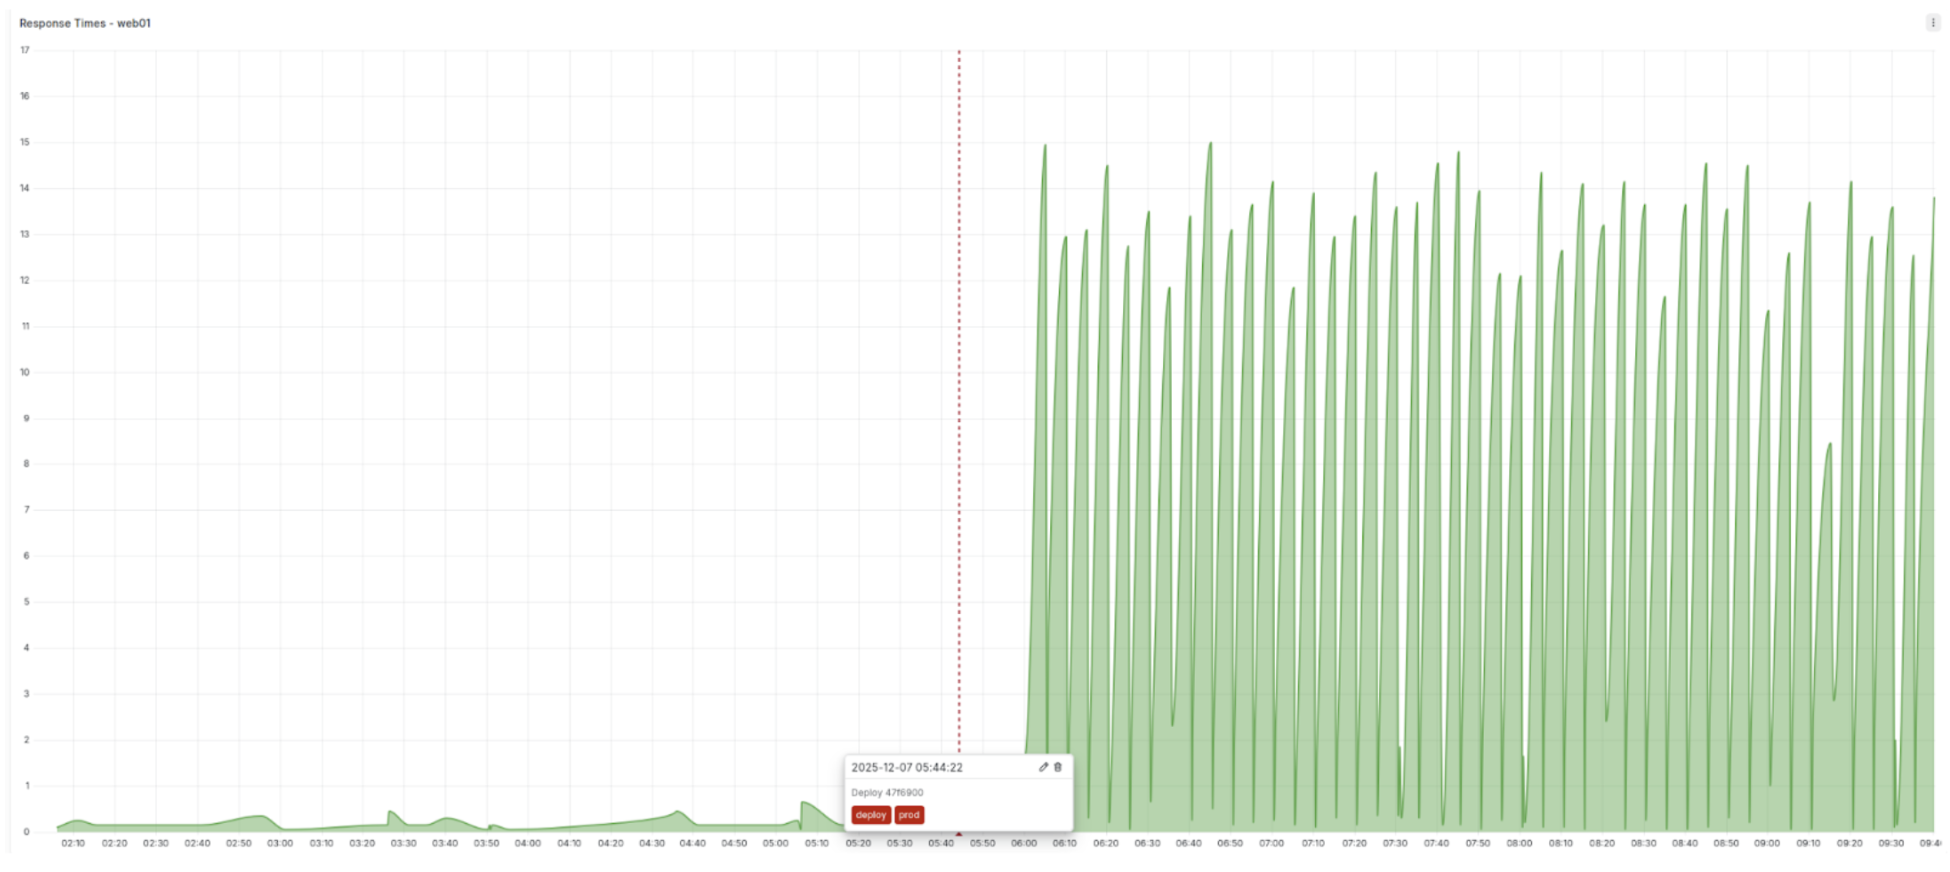
Let’s say you notice an anomaly in your metrics while investigating an outage - a spike in HTTP response times. It may be a problem with the autoscaler, or with a new DB connection pool implementation, or that refactored microservice. How do you find out if you can correlate any of these events with the issue, and thus either eliminate them or dig deeper? It’s cumbersome if you have to look up a change log somewhere and check if the change log times match with the anomaly.What makes this easier is deployment metrics which you can overlay with your other metrics graphs on demand. Correlate the deployment ID with a GitHub changelog to look up what changes went into that deployment.A Grafana example using annotations - the red line shows when the last deployment happened.
Deployments are not restricted to application code. E.g. If you use an IaC like Terraform a recent change in the autoscaler might have caused the increase in response time. This change should be marked as an infrastructure deployment for similar correlation.
No Visibility Into Third-Party Outages
Almost every modern software development process depends heavily on external providers. Your monitoring systems track your applications health but not the services they depend on. The connection timeout in your web app may actually be caused by a Google Cloud networking incident where your app is hosted.One way of staying on top of such incidents is to follow your third-party dependencies’ status pages, or use a tool like IncidentHub which automatically does that for you.
Summary
Outages are high-pressure situations where time sinks can significantly slow down incident response and resolution. Many of these common time sinks can be mitigated with proper preparation and systems in place.
- Building cross-timezone coverage for on-call can help address the "locating the right person" challenge.
- Regular testing and improvement of incident response training and processes can reduce and remove missing runbook and access related issues.
- Visibility into code and infrastructure deployments can make it easier to correlate them with outages.
- Visibility into third-party outages can reduce incident mitigation time by exposing external issues.
The goal of any incident response process is to minimize friction so that teams can focus their energy on actual problem-solving rather than fighting tooling and process obstacles.

Hrishikesh Barua