Ready to make incident response your competitive advantage?
See how Uptime Labs builds provable, scalable incident response capability across your organisation.
We believe in shipping fast and often. Constant small deployments help us move fast, learn quickly and deliver value without bottlenecks. But on July 18th, that same rhythm came with a trade-off.
A seemingly small framework patch - the kind we've applied hundreds of times before - triggered an unexpected chain reaction. By morning, we had a full platform outage on our hands.
We are not sharing the full PIR here, but the parts that matter: what caused the outage, what happened as it unfolded, what surprised us along the way, how we fixed it, and what we have changed so it does not happen again (at least we hope 🤞 ).
As a small startup, the pace of change is critical for both survival and growth. It is one of the key advantages of being a young company: we can adapt quickly, take bold bets and respond to feedback without the weight of legacy processes slowing us down.
To make the most of this, we place a deliberate focus on principles that support fast flow, as recommended in Team Topologies. For us, the goal is simple: get ideas and experiments into the hands of customers as quickly as possible and learn from what happens in the real world.
Our core practice reflects that. We ship lots of small, frequent changes into production every single day. It keeps momentum high, lowers the risk of large releases and helps us learn faster.
Of course, speed comes with trade-offs. Every now and then, a new feature brings an unexpected issue, and tracking it down can be stressful. But we do not see those moments as setbacks. We see them as chances to learn, improve, and strengthen both our systems and our ways of working.
That is why we are not interested in slowing down our flow.
The Incident
(A bit of background to help explain how the incident unfolded.)
At Uptime Labs, we build training simulations that let teams practice incident response. Instead of learning on the job during a live outage, our customers can rehearse realistic scenarios in a way that builds confidence and helps them fall back on muscle memory when that horrible incident inevitably comes around.
A session is what we call a single drill or simulation. When a team or individual launches a session, the platform spins up a realistic incident that unfolds over time. For example, a drill might simulate a payment service going down or a database slowing to a crawl, with alerts firing and dashboards degrading just as they would in production. Players then respond, coordinate and make decisions as if the outage were real.
Behind the scenes, this requires orchestrating complex sequences of events across distributed services. Services have to fail in a specific order, errors need to appear with realistic timing and dependencies must cascade as they do in the real world.
RabbitMQ is central to making this orchestration possible:
- Dynamic queues – Each session plus state combination gets its own temporary queue, which RabbitMQ automatically cleans up when no longer needed.
- Session isolation – Ensures every simulation runs independently without interfering with others.
This design is powerful and reliable, but it also means the broker is sensitive to sudden bursts of unexpected queue creation. That sensitivity is what led to the outage on July 18.
The Initial Report
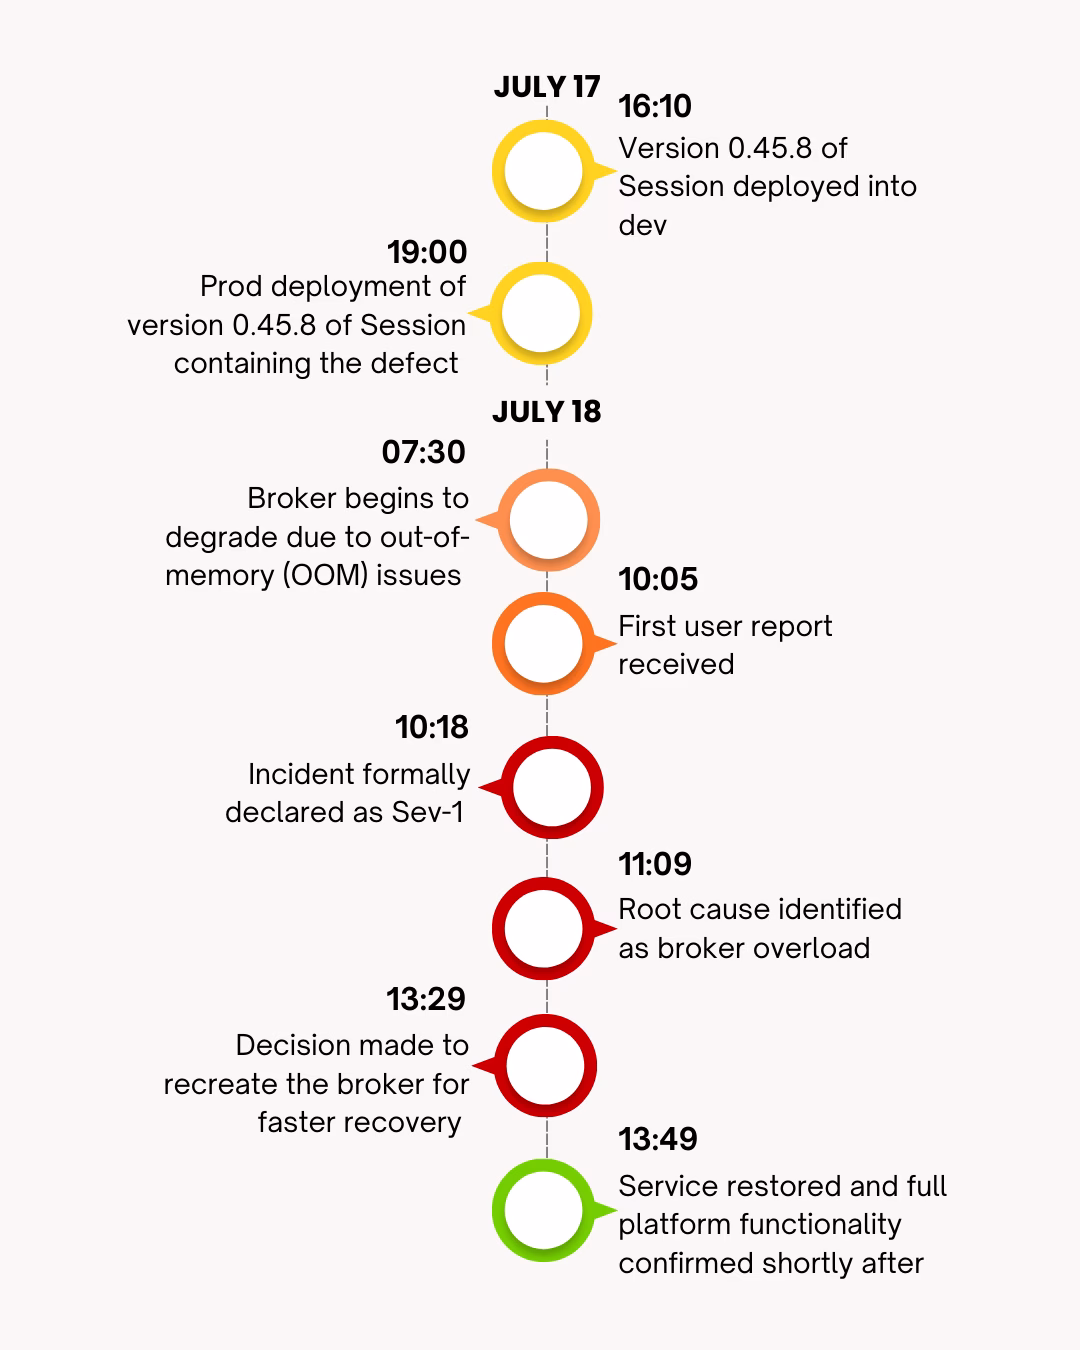
It all began around 10:05 AM when the first reports landed: sessions were starting, but no narratives were coming through. At first, it looked like an isolated glitch, but soon we noticed something bigger. User-facing services had slowed to a crawl, with messages lagging by 10 to 15 seconds. As more reports rolled in, it became clear we had a platform-wide problem on our hands.
The incident was escalated to Sev-1 once message delays stretched to nearly a full minute. To protect customers, we made the tough call to abort all sessions while we worked on recovery.
Our troubleshooting process involved rolling back several small changes to isolate the breaking change. Because we push updates frequently, this took time, but it was necessary to uncover the underlying root cause. Along the way, we chased a few red herrings, since the symptoms appeared across a number of seemingly unrelated workflows:
The Red Herrings
- Multiple instance initialisation: Not the cause, as the NestJs framework we use relies on singletons.
- Workflow execution: The affected workflow never ran during the incident.
- Dependency injection errors: No circular dependencies or injection issues were present.
- Multiple ClientProxy instances: Already existed without issues.
- Service instantiation order: No changes were made to when
InfraReadyServicewas created. - Queue configuration differences:
API_SERVICEfollowed the standardRmqServicepattern. - Bootstrap timing conflicts: Health and service modules followed normal NestJS lifecycle rules.
The Cascading Effect
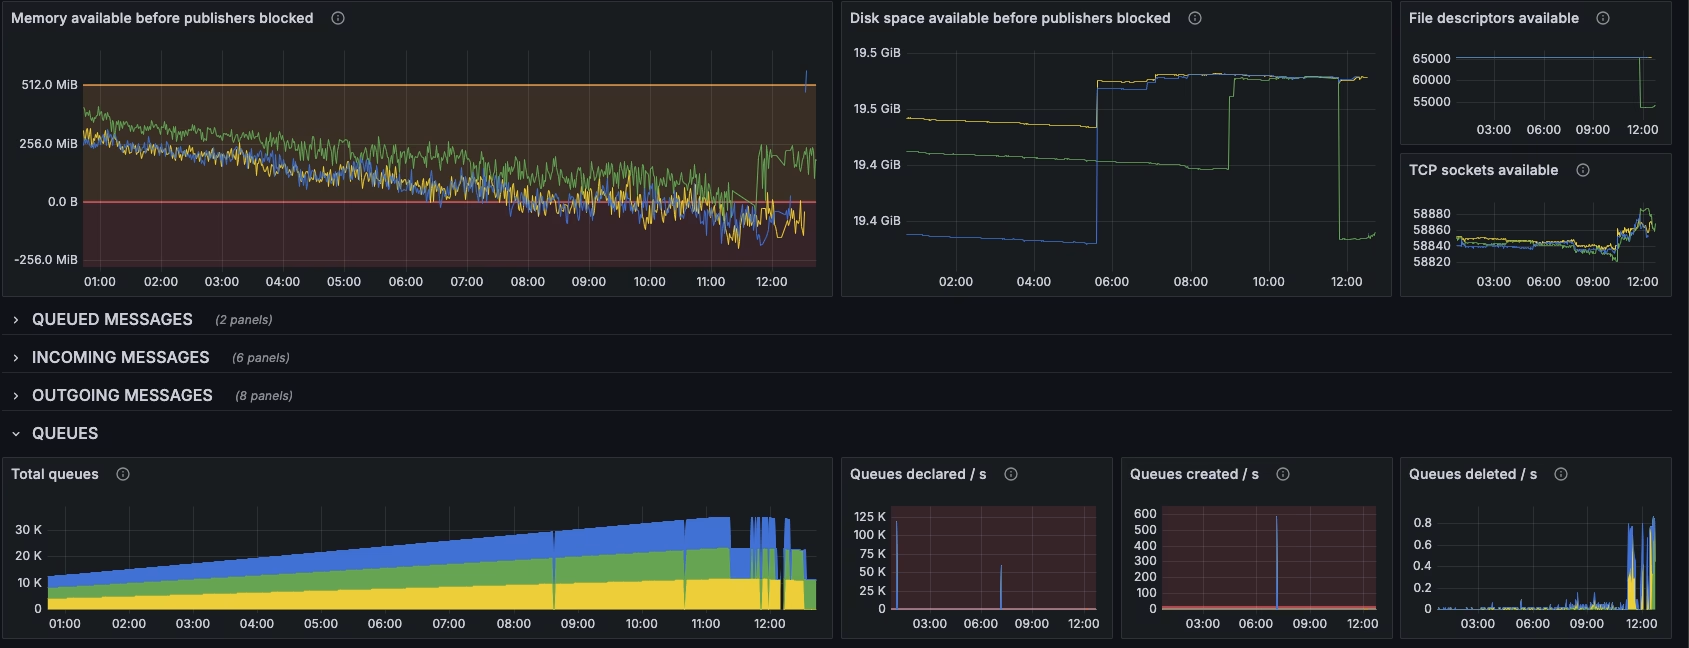
With multiple service replicas running in production, health checks were being executed frequently across all instances. Each health check hit resulted in a new dynamic queue being created. Over time, this led to:
- Over 35,000 queues being created
- RabbitMQ broker memory exhaustion
- Complete message handling failure
- Full platform outage
The problem was amplified by the number of replicas running - more replicas meant more health check requests, which meant exponentially more dynamic queues being created.
Eventually, we narrowed it down to the following:
- v0.45.6:
API_SERVICEinjected intoInfraReadyController— no dynamic queues. - v0.45.7: Same injection added to
InfraReadyService— dynamic queues appeared.
This pointed us to the real issue. Switching to static queue configuration for health checks resolved the defect.
The Technical Fault
The outage was caused by a breaking change disguised as a patch release in NestJS framework version 11.1.4.
In the framework update from version 11.1.3 to 11.1.4, NestJS changed a critical default value:
- Previous version (11.1.3):
export const RQM_DEFAULT_QUEUE = 'default'; - New version (11.1.4):
export const RQM_DEFAULT_QUEUE = '';
This seemingly minor change had major implications. The health check system performs connectivity tests to RabbitMQ queues. In the previous version, when no specific queue was specified, it would connect to the 'default' queue. However, with the new empty string default, the underlying rabbitmq-client library interprets this as a request for a dynamic queue.
By design, when no queue name is provided to the rabbitmq-client library, it automatically creates a new dynamic queue. This meant that every health check request was now creating a new queue instead of connecting to an existing one.
We include the framework version here for clarity, not to assign fault. Incidents like this are part of working with complex systems, and they happen to every team. What matters is how we respond, what we learn, and how we strengthen our systems.
This was fundamentally a breaking change that should have been included in the next major or minor version of the release, not in the immediate patch release.
The Resolution
For Immediate Resolution (During the incident):
- Rolled back the patch to stop new dynamic queue creation
- Coordinated with Customer Success to cancel active sessions while a separate team focused on troubleshooting. This kept customers informed and reduced impact while the root cause was being investigated.
- We spent time attempting to drain the message queues, but the broker’s memory issues meant it was not responsive enough and too slow to meet recovery goals. Eventually, we realised this approach would not succeed and made the call to take a much more drastic step: the nuclear option of recreating the broker.
- Recreated the broker as a pragmatic restoration step to bring the platform back quickly. Because we follow infrastructure-as-code practices, the rebuild was far more seamless and faster than we had initially expected, with significantly less risk.
For Lasting Resolution (Post-incident):
- Updated health checks to use a static queue, permanently removing the defect trigger.
Timeline
The Issues and Preventive Actions
After the PIR, we stepped back and looked at the incident through several different lenses, following the principles of blamelessness, continuous improvement, and systems thinking. That meant not just focusing on the technical fault but also examining the process and human elements involved. Here are some of the highlights we discovered and the actions we’ve taken.
Monitoring and Visibility
- Issue: Monitoring gaps in the cluster meant certain performance metrics were not visible, making it harder to associate system behaviour with specific timeframes and delaying progress.
- Action: This monitoring gap has been fixed. Queue depth and memory high watermark usage metrics are now visible in Grafana, with PagerDuty alerts integrated for early warning.
Integration and End-to-End Testing
- Issue: Integration tests failed in dev overnight and went unnoticed for a few hours. In prod, tests were still passing during morning checks and only began failing once external reports surfaced.
- Recommendation: Include test health in morning checks and treat persistent failures in development as Sev-1 until the root cause is known, unless the impact is clearly isolated.
- Action: Increased cadence of end-to-end tests in production to a much more aggressive cycle, shortening the feedback loop.
Alerting
- Actions:
- PagerDuty alerts are being actively tuned for signal-to-noise ratio.
- Making changes to our alert rules in our repo to sharpen signals
Caution Around Current Framework
- Issue: A ‘patch’ introduced breaking behaviour.
- Recommendation: Be cautious when introducing this framework to new services until stability is verified.
The Conclusion
Shipping fast and often is what keeps our product moving, and we are not slowing that down. Sometimes speed will surface issues. Our job is to catch them quickly, recover fast, and learn from every incident.
This incident pushed us to strengthen monitoring, visibility, testing, and on-call readiness. Importantly, we also treated the fixes in development as an incident of their own. This reflects one of our core principles: treating dev outages as incidents so resilience is strengthened early rather than only once issues appear in production. We have written more on this principle here: ‘Turning Non-Prod Incidents into Resilience-Building Opportunities'.
We also have a simple rule of thumb: key infrastructure components should soak in dev for at least a working day before release. In practice, we often soak them during core hours and then ship. With stronger monitoring and alerting now in place, we are more confident that if something slips through, we will be on it quickly.
Because we are a small team, we keep our setup streamlined: just a development environment and a production environment. That lean approach makes it easier to maintain and ensures we can move fast when we break things. Speed of delivery is essential to us - we know sometimes things will break, but our pragmatic approach is to catch them fast, resolve them swiftly and keep improving without slowing the flow of delivery.
Because in the end, resilience is not about avoiding every failure. It is about being ready to respond when it matters.
TL;DR
- Speed has trade-offs – moving fast sometimes surfaces issues, but catching them quickly matters more than slowing down.
- Every incident is a learning opportunity – our focus is continuous improvement, not blame.
- Treat dev outages like incidents – resilience starts in development, not only in production.
- Monitoring and visibility are critical – the earlier we detect, the faster we can respond.
- Pragmatism over perfection – fast recovery first, permanent fixes after.

Joe Mckevitt